The Corymbus CRM dashboard has a graph summarizing the sales outlook month by month, by default for the current calendar year.
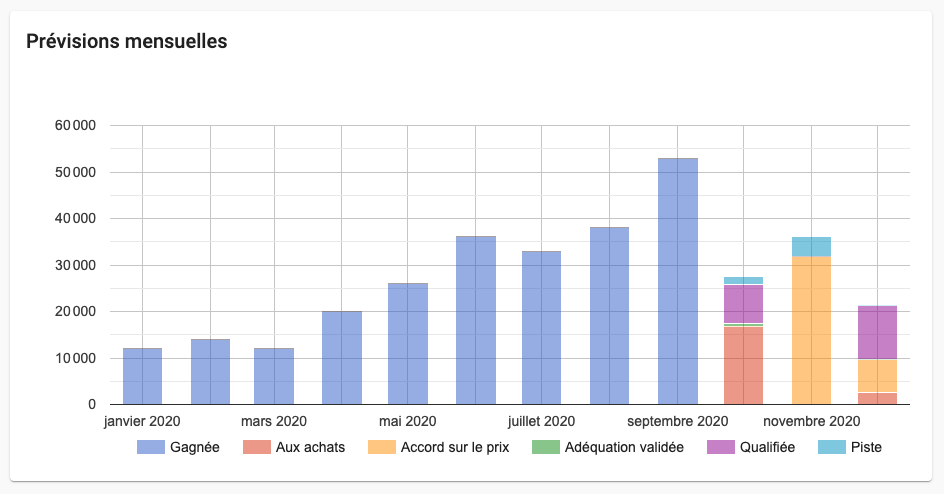
You can set it to display different information, for example:
- previous year’s sales
- next year’s sales
- sales in your fiscal year starting not on January 1 but on April 15
- growth over the last 3 years
- the recurrence of sales made with a given customer
- …
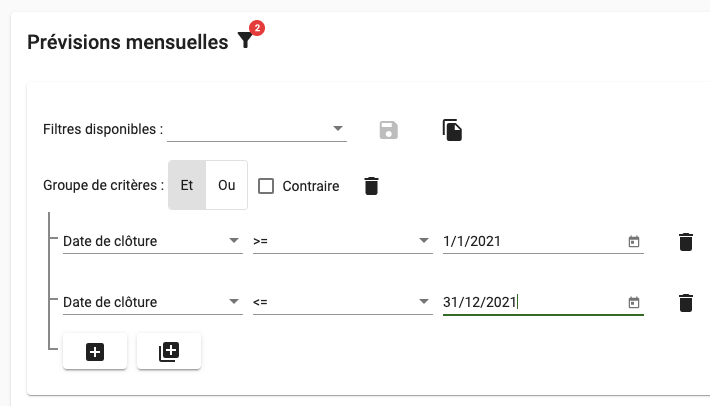
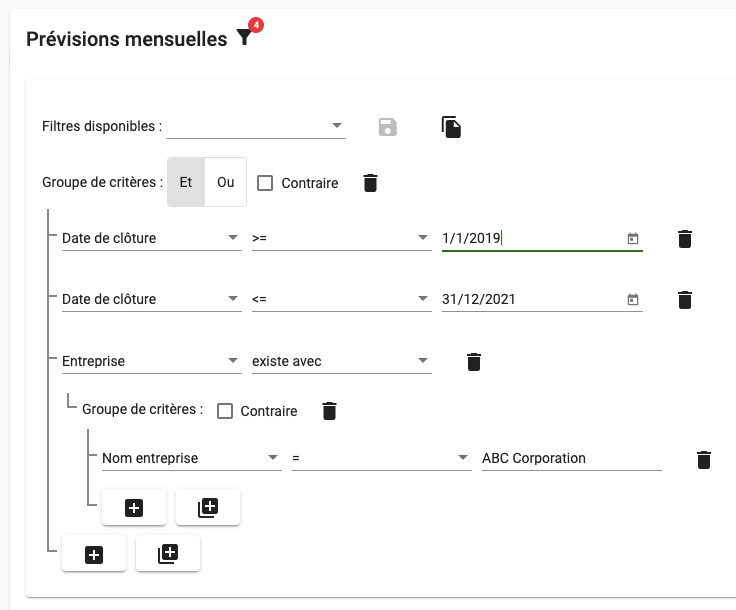
It is based on Corymbus’ concept of filters , and allows you, for example, to choose the start and end dates of reporting: to have an overview of the year 2021, indicate that you only want to take into account opportunities whose closing date is between January 1, 2021 and December 31, 2021.
To see several years, for example, enter dates from January 1, 2019 to December 31, 2022.
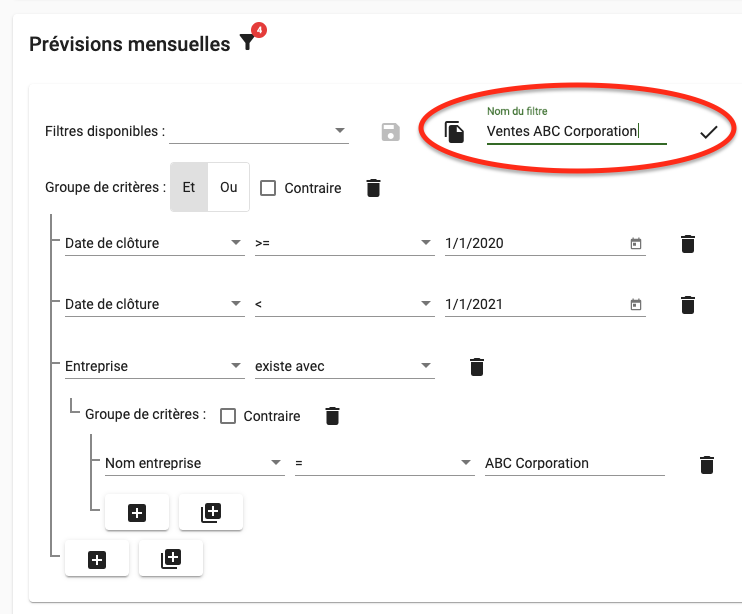
To see the recurrence of sales with a given customer over 2019-2020-2021, add a criterion to consolidate only the opportunities related to this customer:
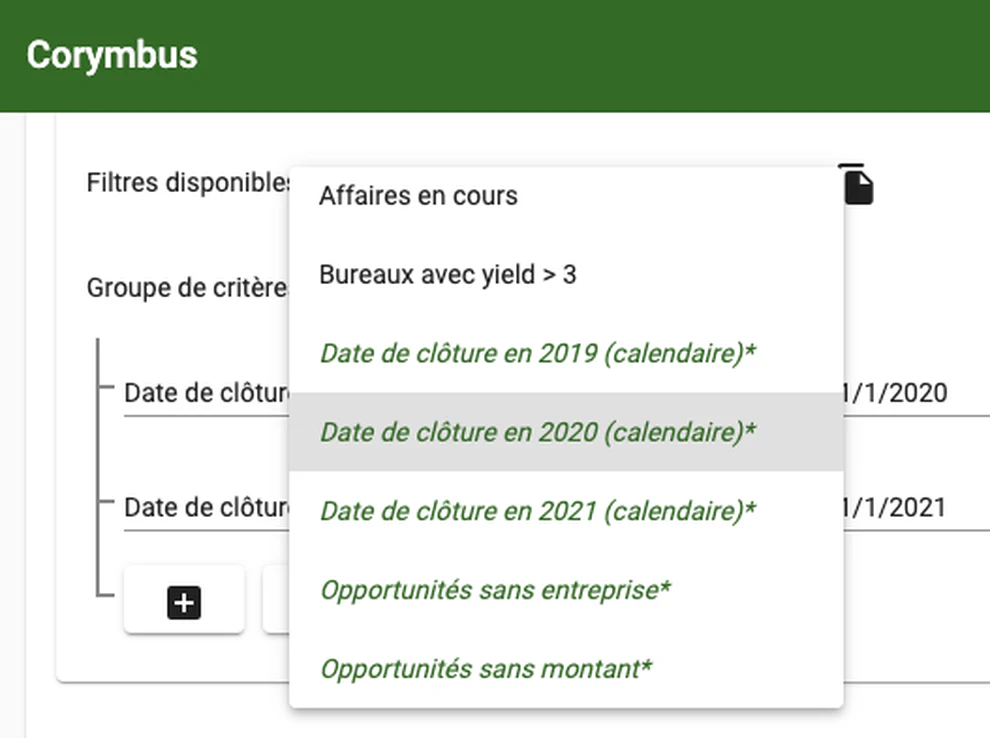
To simplify the task and save you time, predefined filters are proposed:
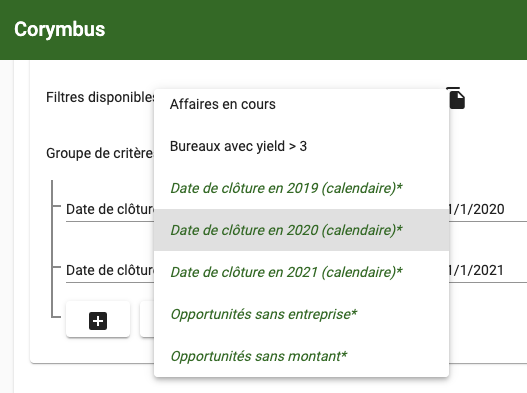
When a filter is applied, it remains active on your browser until you use a new one, so you don’t have to redefine it every time. In addition, if you have to use a filter regularly, you can save it to recall it later, it will then be accessible in the list of available filters: